At the end of every year, we like to read through some of the major reports on inbound marketing, content marketing, social media, and online behavior.
It’s amazing how fast things can change in just one or two years, and this year has a breadth of surprising statistics to reflect on.
This year, we’ve seen the continued importance of visual content emphasized by the changes that occurred across almost every major social network, including Facebook, Instagram, and Twitter. At the same time, videos continued to grow as powerful tools for brands looking to communicate more easily with their readers, and virtual reality (VR) is finding its place as a marketing tool in numerous businesses.
![Download Now: State of Marketing Report [2020 Version]](https://no-cache.hubspot.com/cta/default/53/3d0bc27a-898d-40d5-aa46-8696ed81c4ee.png)
To help you keep pace with these trends, let’s take a look at some visual content marketing statistics that demonstrate the impact visual content has on reach, engagement, and sales. You can jump to the following categories to see statistics related to that category:
- General Visual Content Stats
- Video Marketing Stats
- Emerging Visual Marketing Stats
- Infographic Stats
- Social Media Stats
50 Visual Content Marketing Statistics You Should Know
General Visual Content Statistics
- 70% of companies invest in content marketing, which could include visual marketing strategies. (HubSpot)
- The primary form of media used in content marketing is video. (HubSpot)
- One fourth of marketers are investing in content marketing related to product promotions while just over 20% of investing in branded storytelling specifically. (HubSpot)
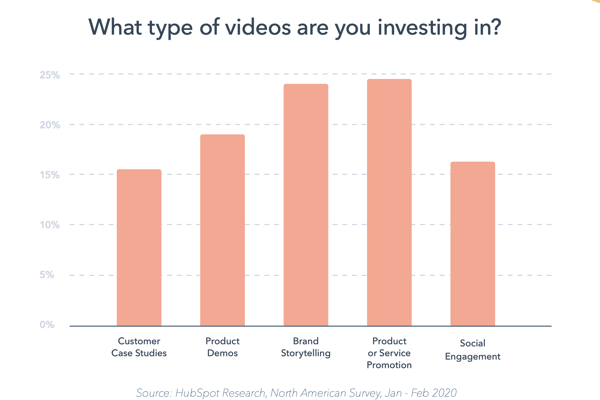
Source: HubSpot
- Marketers spend the most time creating content for Facebook and their own company website, respectively. (HubSpot)
- Design and visual content is the biggest challenge for 23.7% of content marketers. (Adam Enfroy)
- 49% of marketers rate visual marketing as Very Important to their marketing strategy, and 22% consider it Important, and 19% say that their strategy is nothing without visual content. (Venngage)
- 49% of marketers primarily use visual content on blogs and websites followed by social channels such as Facebook and Instagram. (Venngage)
- When people hear information, they’re likely to remember only 10% of that information three days later. However, if a relevant image is paired with that same information, people retained 65% of the information three days later. (Brain Rules)
- 40% of marketers predict that between 51% and 80% of businesses will heavily rely on visual content into 2021. (Venngage)
Video Marketing Statistics
- Mobile video consumption has increased 17 fold since 2012. (Cisco)
- Cisco projects that global internet traffic from videos will make up 82% of all consumer internet traffic by 2022. (Cisco)
- 70% of YouTube viewers watch videos for “help with a problem” they’re having in their hobby, studies, or job. (Think With Google)
- Globally, YouTube is consumers’ leading source of video content, at 83% (Facebook is second, at 67%). (HubSpot)
- Video streaming has increased significantly in the last several years. The live-streaming platform, Twitch, saw year-over-year growth of 14.3% in 2020 and boasted up to 1.645 billion watch hours per month. (eMarketer, The Verge)
- In a 2018 HubSpot survey, 54% of consumers wanted to see more video content from a brand or business they support. (HubSpot)
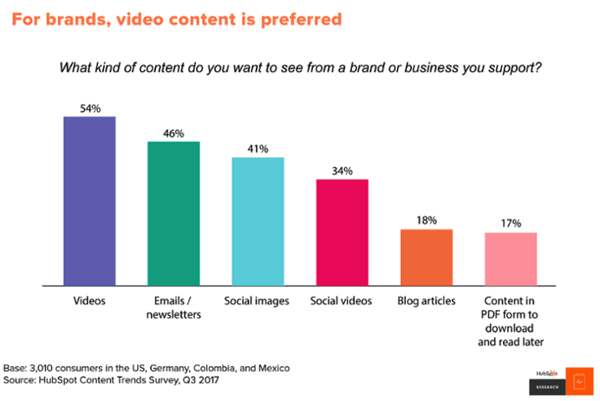
Source: HubSpot Research
Emerging Visual Marketing Trends
- In 2019, 42.9 million people in the US used a VR product, and 68.7 million people used an AR once monthly. (eMarketer)
- Spending on VR for business is expected to reach $9.2 billion by 2021, outpacing its use for leisure. (FinancesOnline)
- A quarter of VR users believe it has a strong potential for brands and marketers. (GlobalWebIndex)
- 64% of consumers say VR has the most potential in gaming, while 52% recognize its potential in Film and TV. (GlobalWebIndex)
- 57% of marketers used live video in 2019. (Social Media Examiner)
- Facebook lives generate 10 times more engagement than traditional videos. (BloggingX)
- 90% of all video plays on Twitter take place on mobile devices. (HubSpot)
- 73% of videos are two minutes or less in length. (Vidyard)
- 85% of adults consume content on multiple devices at the same time. (Think With Google)
- According to the Lowes home improvement store, how-to videos that were shown in virtual reality (VR) had a 36% higher recall by viewers compared to people who only viewed the YouTube video. (HubSpot)
Infographic Stats for Visual Content Marketers
- Infographics are the fourth most used type of content marketing. (HubSpot)
- Infographics have had the biggest increase in usage among B2B marketers in the last four years — now at 67%. (Content Marketing Institute)
- People following directions with text and illustrations do 323% better than people following directions without illustrations. Take content marketer Ryan Robinson’s guide on how to start a blog as an example, where he teaches readers the process of building a blog through a combination of text, illustrations and infographics. (Springer)

Source: NeoMam
Social Media Stats for Visual Content Marketers
- In a general survey of over 250 consumers, 70% said they watched Facebook Stories more often than Instagram or Snapchat Stories. (HubSpot)
- Over 500 million Instagram accounts use Stories every day, and 4 million businesses use Stories ads every month 58% of people surveyed say they have become more interested in a brand/product after seeing it in Stories.. (Instagram Business)
- As of January 2021, the largest demographic of U.S. Instagram users were between 25 and 35, making up 33.1% percent of Instagram’s user base in the U.S. (Statista)
- In 2019, Instagram accounted for approximately 31.8% of Facebook advertising revenues, up from 13.2% in 2016. (Statista)
- Of the Instagram Story formats people prefer most, 35% say they engage with short narrative-styled Stories most often, followed by interactive Stories centered around quizzes and polls. (HubSpot)
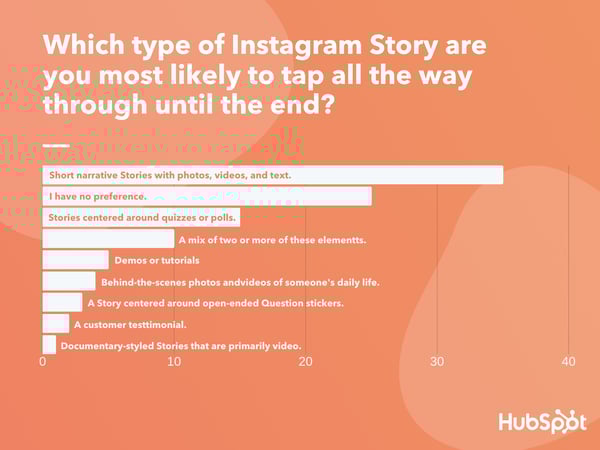
Data Source: Lucid Software
- According to Verizon Media, 69% of consumers watch online videos with the sound off. (Forbes)
- In a poll of over 300 consumers, 56% said they “sometimes” watch social media Stories with the sound on, while 29% said they “always” do this. (HubSpot)
- 72% of teenagers use Instagram and nearly as many (69%) use Snapchat. Both have increased by more than 20% since 2015. (Pew Research)
- Tweets with video get 10 times more engagement than those without. (Twitter Business)
- In an analysis of over 1 million articles, BuzzSumo found that articles with an image once every 75-100 words received double the social media shares as articles with fewer images. (Buzzsumo)
- Facebook posts with images see 2.3X more engagement than those without images. (Buzzsumo)
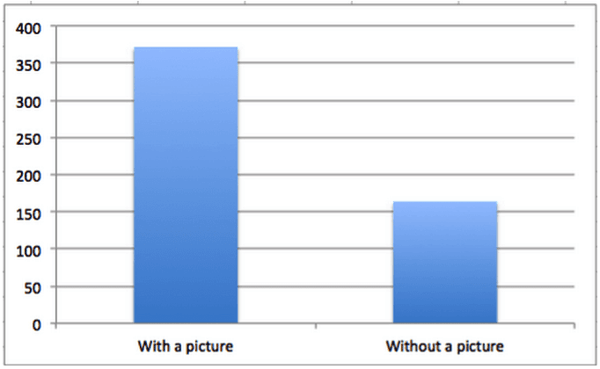
Source: Buzzsumo
- There are more than 500 million Instagram users active every day. (Statista)
- 15% of all Facebook content is video – an increasing percentage. (Socialinsider)
- The optimal video length for better engagement on Facebook is between 2 and 5 minutes. (Socialinsider)
- Snapchat had 249 million daily active Snapchat users as of 2020. (Statista)
- Advertisers can reach more than 169 million people on Pinterest. (Hootsuite)
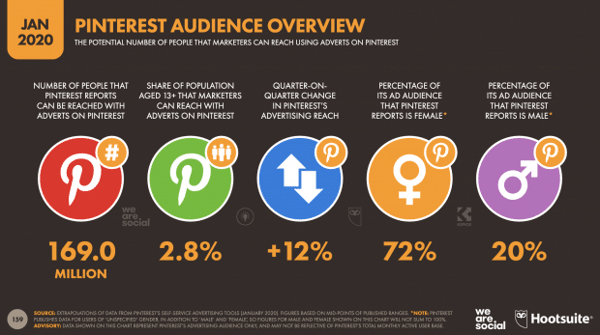
Source: Hootsuite
- Revenue from Pinterest shopping ads grew by 100% in 2019. (Pinterest)
- Pins that show a product or service in action are 67% more likely to drive sales. (Pinterest Business)
- YouTube reaches more 18+-year-olds during prime-time viewing hours than any cable TV network. (Think With Google)
- Half of YouTube subscribers between the ages of 18 and 34 would drop whatever they were doing to watch a new video from their favorite channel. (Think With Google)
Editor’s note: This post was originally published in April 2020 and has been updated for comprehensiveness.


![How to Write a Video Script [Template + Video]](https://vmkagency.com/wp-content/uploads/2024/03/video-outline.pngkeepProtocol-500x383.png)
![The Ultimate Guide to Google Ads [Examples]](https://vmkagency.com/wp-content/uploads/2024/03/adwords-ppc_4.webpkeepProtocol-500x383.webp)